Author: Charles Chamberlin

  • New publication: measuring residence time distributions in screw conveyor reactors

    New publication: measuring residence time distributions in screw conveyor reactors

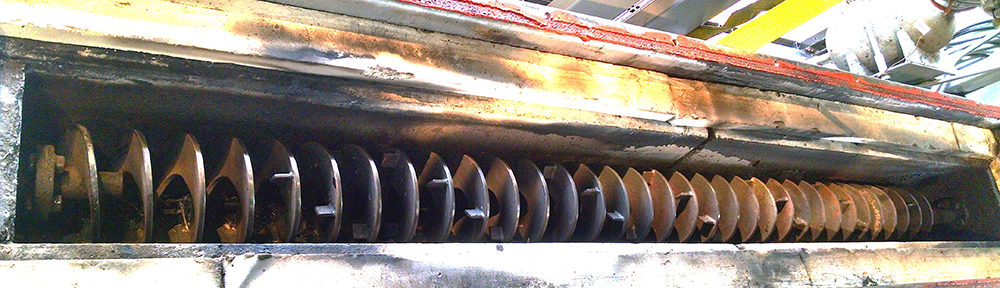
    Charles Chamberlin, David Carter, and Arne Jacobson recently authored an article on measuring residence time distributions of wood chips in a screw conveyor reactor. A screw conveyor or auger makes use of a rotating helical blade inside of a tube or trough to move wood chips, sawdust, flour, or other granular materials through a reactor — such as a dryer, heater, cooler, gasifier, or torrefier. How much change in the materials takes place in such reactors depends on the average residence time and how variable that residence time is.

    This paper compares three alternative methods for measuring the residence time distribution of wood chips in a screw conveyor reactor using experimental results from a pilot scale torrefier:

    • addition of material to an empty reactor (step-up),
    • halting addition of material to a reactor under steady flow, (step-down), and
    • addition of a pulse of labelled material (i.e., a tracer) to a reactor under steady flow.

    We found that all three methods yield residence time distributions that are approximately symmetrical and bell-shaped, but the distribution estimated from the pulse input of tracer exhibited a long trailing tail that was not detectable in either the step-up or step-down results. Second, we demonstrated that a normal probability plot provided a useful way to display and analyze the distributions obtained in the tracer experiments. Finally, we observed that all three methods yielded mean residence times that consistently differed from the nominal values, with the step-up method averaging 8% shorter, the pulse addition of tracer averaging 7% longer, and the step-down averaging 60% longer.

    The article appeared in the August 2018 issue of Fuel Processing Technology.

  • Schatz History: the Trinidad photovoltaic array

    Schatz History: the Trinidad photovoltaic array

    From 1990 through 2016, a 9.2kW photovoltaic (PV) array located at the Humboldt State Telonicher Marine Laboratory in Trinidad, CA powered the Schatz Solar Hydrogen Project. This array provided the energy to aerate the Marine Laboratory aquaria either directly or indirectly through a Teledyne Energy Systems ALTUS™ 20 electrolyzer that produced hydrogen fuel for a proton exchange membrane fuel cell.

    Located ~150 meters from the Pacific Ocean in a cool, marine climate, the array consisted of 192 ARCO M75 modules made with single-crystal silicon and rated at 48W. Prior to array installation in 1990, Jim Zoellick measured the current-voltage (I-V) curves for each module and discovered that even when new, the average peak power under full solar illumination at normal operating cell temperature was 39.9W – 14% below the 46.4W nameplate rating.

    After 11 years of field exposure, Antonio Reis and Nate Coleman retested each module’s I-V curve in 2001 and found that the average peak power had fallen by 4.3% to 38.1W. They attributed the drop in performance to visually observable defects in the modules, especially the delamination of the modules’ ethylene vinyl acetate (EVA) encapsulant, leading to shading and corrosion of the cells and the occurrence of localized hot spots.

    After 20 years of service, Marc Marshall, Mark Rocheleau, and Scott Rommel again retested each module’s I-V curve in 2010, and found that the average peak power had fallen an additional 12.4% to 33.4W and that the variation among the modules had dramatically increased.

    After over 26 years of field service, the array was decommissioned in 2016. All of the 192 modules were removed and tested one last time by Jacob Rada, a M.S. candidate working at SERC. He found that the average peak power had fallen 22% since 1990, with an average degradation rate of 0.85%/yr, and that the variation among the modules had increased further since 2010. Each original module was discolored and showed some degree of delamination.

    Having now been individually tested four times over 26 years, these are some of the oldest carefully monitored solar modules from a working array. Of the original 192 models, 188 modules were still in service after 26 years. One module was damaged in 1996 and was replaced with a module of similar size and performance characteristics. Three other modules were later replaced due to physical damage.

    In the coming year, we will be hanging seven of the modules with their corresponding I-V curve data in the staircase of our main building, as a celebration of our Center’s first project and as a teaching tool for university students and visitors.